Hi friends, today I’m sharing with you my findings after using Facebook’s (Meta) forecasting tool to predict Tesla stock, and how it compares to an LSTM. In this article we will go over the difference in the types of models we are comparing against, error metrics, and ease of use. This will be a high level overview and not an in depth tutorial. I’m simply sharing my results.
Let’s dive in.
For some clarity, Prophet is a local Bayesian time series machine learning algorithm developed by Meta (Facebook) that is used for business forecasting, known for how easy it is to use as well as its predictive ability. This is the control variable we are using for my experiment.
An LSTM stands for Long Short Term Memory, which is a Recurrent Neural Network often used in the prediction of sequential data.
I used Prophet first, so let’s dive into its results.
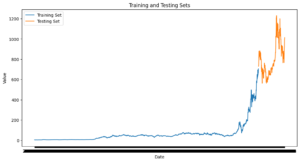
Data Description: TSLA stock, ranging from 2010 to 2022.
Train Size: 90% (Blue)
Test Size: 10% (Orange)
Data Visual:

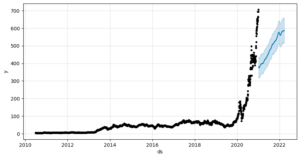
Model Prediction Visual:

Black – Actual Values
Blue Line – Predicted Values
Light Blue Shaded Area – Upper and Lower Bounds
Now that you have the visuals, let’s get a breakdown on the Error Metrics we will be using to evaluate the performance of this model.
MSE (Mean Squared Error) – Quantifies the average squared difference between predicted and actual values.
MAPE (Mean Absolute Percent Error) – Calculates the average percentage difference between predicted and actual values.
Usually, the lower these numbers are the better.
Recorded MSE: 344.66
Recorded MAPE: 0.38
Overall Analysis:
MAPE sits at 38%. Meaning that the predictions are on average, 38% off from the actual recorded values. Not that good. This indicates possible underfitting, and that the model possibly ignored some features and patterns in the data. Keep in mind that Prophet is a Bayesian time series model, which for sequential data with high variability might not be the best for something like a stock prediction problem.
Overall, not bad but there is huge room for improvement. Would not use this model for this kind of data with a client who’s data resembles this one, as the error shows to be too large.
Now, let’s test the LSTM and see how it performs in comparison to the Prophet model.
Data Description: Same as before.
Train Size: 90% (Same as before)
Test Size: 10% (Same as before)
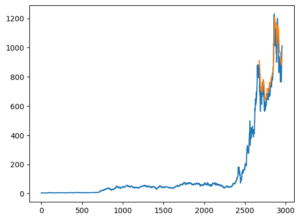
Model Prediction Visual:

Blue Line – Actual Data
Orange Line – Model’s predictions on the test set (Remaining 10%)
Recorded MSE: .0045
Recorded MAPE: .007
Overall Analysis:
MAPE sits at 7%, which is an impressive improvement over the previous Bayesian model’s 38%. This means that the LSTM model’s predictions are, on average, only 0.7% off from the actual values. This is a strong indication that the LSTM has effectively captured the underlying patterns in the data. Given the sequential nature of the data, it’s no surprise that an LSTM, which is designed for handling time-series problems, outperforms Prophet in this case.
With an MSE of 0.0045, the error is low, showing that the model is making small, squared errors in prediction. The fact that the MAPE is also low indicates that the model performs well across different magnitudes of the target variable, which is crucial when dealing with real-world data.
However, even with these strong results, there’s always room for refinement. The LSTM model is more complex than a Bayesian approach, and while it’s delivering great results here, I would continue to monitor how it performs with different datasets, particularly those with more variability. Additionally, some regularization or further hyperparameter tuning could potentially squeeze out even more accuracy.
Overall, the LSTM is performing excellently and would be much more suitable for a client-facing solution where accuracy is critical. For datasets like this, I’d confidently recommend this model over Prophet.
